This page contains quantitative portfolio selection data divided in two categories:
- Fama-French portfolios for 12 developed and 4 emerging markets
- single factor portfolios (P/E, P/B, P/S, P/CF, P/FCF, D/P, Current Ratio, ROE, 1 year EPS growth, gross profit margin, 1 year total return) for 5 geographical regions.
We provide current and historical returns data (downloadable files) of Fama/French factors and portfolios relative to developed and emerging markets (see the list of markets on the left). We follow the
methodology outlined in Fama and French
original paper.
Details about the methodology can be
found here.
We provide historical returns data (downloadable files) of single factor portfolios relative to 5 geographical regions (see the list of regions on the left).
Details about the methodology can be
found here.
Database and computational platform are provided by FactSet.
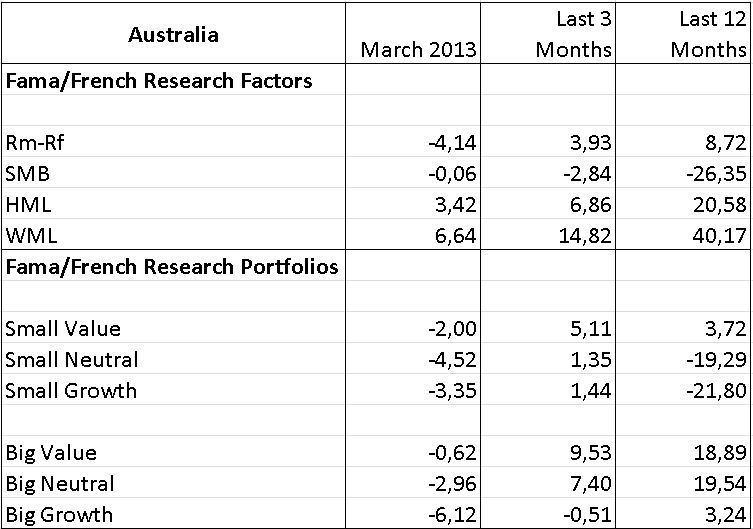
Australia: Fama/French Factors, 6 Portfolios Formed on Size and Book-to-Market, 6 Portfolios Formed on Size and Momentum (downloadable files).
Market: ASX. Risk free rate: Australia yield 90 days bank-accepted bills. Time series (start date): July 1988. Returns in AUD.
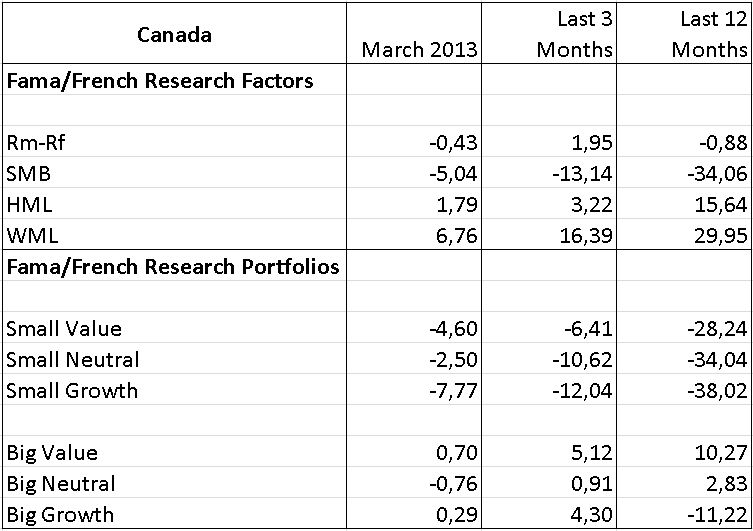
Canada: Fama/French Factors, 6 Portfolios Formed on Size and Book-to-Market, 6 Portfolios Formed on Size and Momentum (downloadable files).
Market: Toronto, TSX Ventures, Montreal. Risk free rate: Canada Central Bank rate. Time series (start date): July 1988. Returns in CAD.
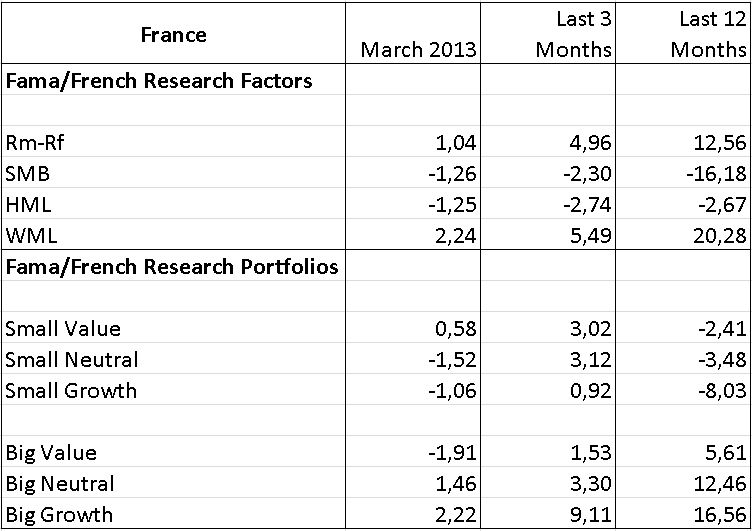
France: Fama/French Factors, 6 Portfolios Formed on Size and Book-to-Market, 6 Portfolios Formed on Size and Momentum (downloadable files).
Market: Paris. Risk free rate: France 3 months Treasury bill rate. Time series (start date): July 1988. Returns in EUR.
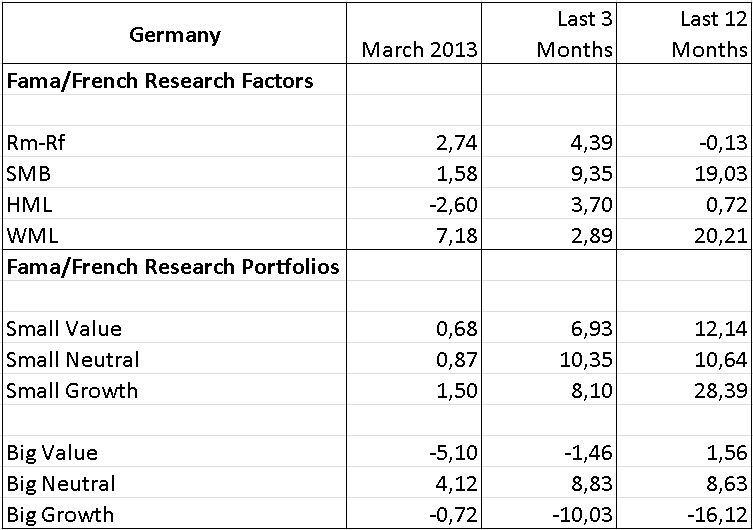
Germany: Fama/French Factors, 6 Portfolios Formed on Size and Book-to-Market, 6 Portfolios Formed on Size and Momentum (downloadable files).
Market: Frankfurt. Risk free rate: Germany 3 months Treasury bill rate. Time series (start date): July 1988. Returns in EUR.
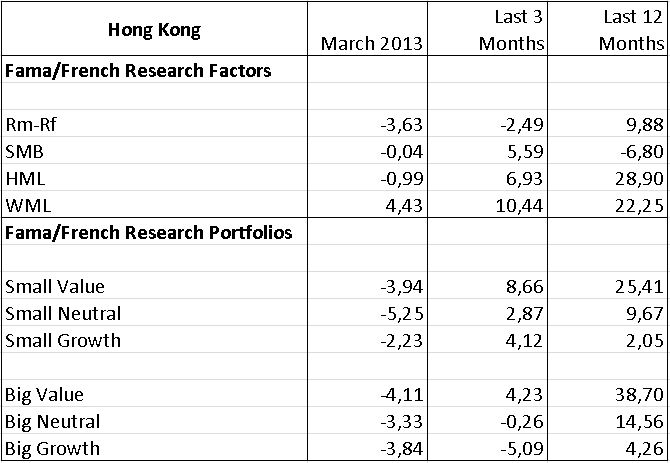
Hong Kong: Fama/French Factors, 6 Portfolios Formed on Size and Book-to-Market, 6 Portfolios Formed on Size and Momentum (downloadable files).
Market: Hong Kong. Risk free rate: Hong Kong 3 months deposit rate. Time series (start date): July 1988. Returns in HKD.
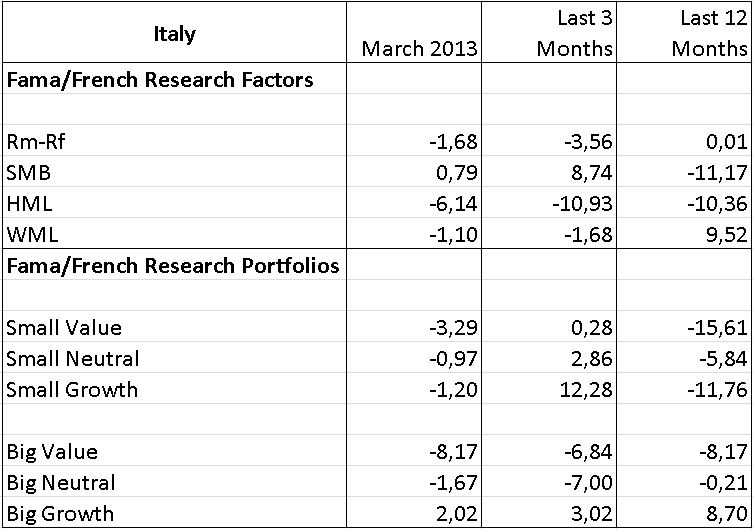
Italy: Fama/French Factors, 6 Portfolios Formed on Size and Book-to-Market, 6 Portfolios Formed on Size and Momentum (downloadable files).
Market: Milan. Risk free rate: Italy 3 months Treasury bill rate. Time series (start date): July 1988. Returns in EUR.
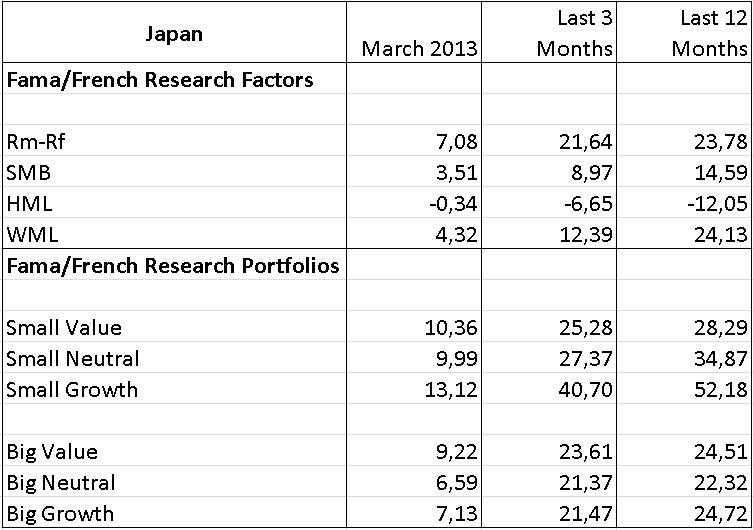
Japan: Fama/French Factors, 6 Portfolios Formed on Size and Book-to-Market, 6 Portfolios Formed on Size and Momentum (downloadable files).
Market: Tokyo, Jasdaq, Osaka. Risk free rate: Japan Central Bank discount rate. Time series (start date): July 1988. Returns in JPY.
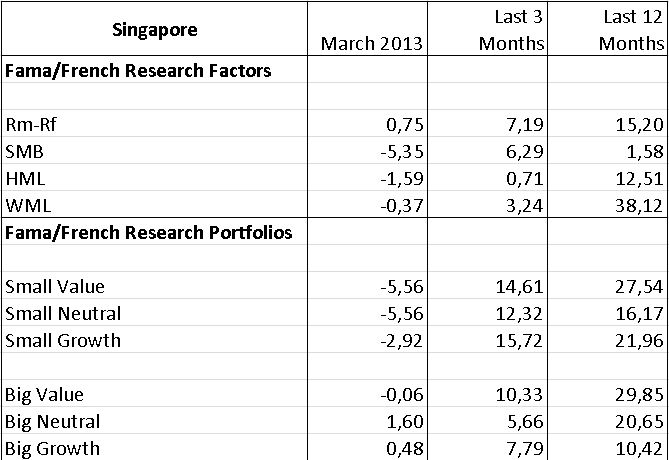
Singapore: Fama/French Factors, 6 Portfolios Formed on Size and Book-to-Market, 6 Portfolios Formed on Size and Momentum (downloadable files).
Market: Singapore. Risk free rate: Singapore 3 months Treasury bill rate. Time series (start date): July 1988. Returns in SGD.

Sweden: Fama/French Factors, 6 Portfolios Formed on Size and Book-to-Market, 6 Portfolios Formed on Size and Momentum (downloadable files).
Market: Stockholm, Nordic Growth. Risk free rate: Sweden 3 months bond. Time series (start date): July 1988. Returns in SEK.
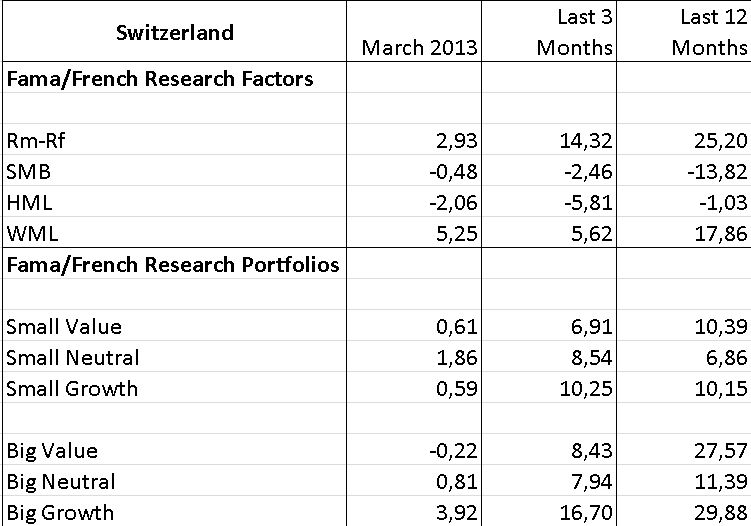
Switzerland: Fama/French Factors, 6 Portfolios Formed on Size and Book-to-Market, 6 Portfolios Formed on Size and Momentum (downloadable files).
Market: Six Swiss. Risk free rate: Switzerland 3 months Treasury bill rate. Time series (start date): July 1988. Returns in CHF.
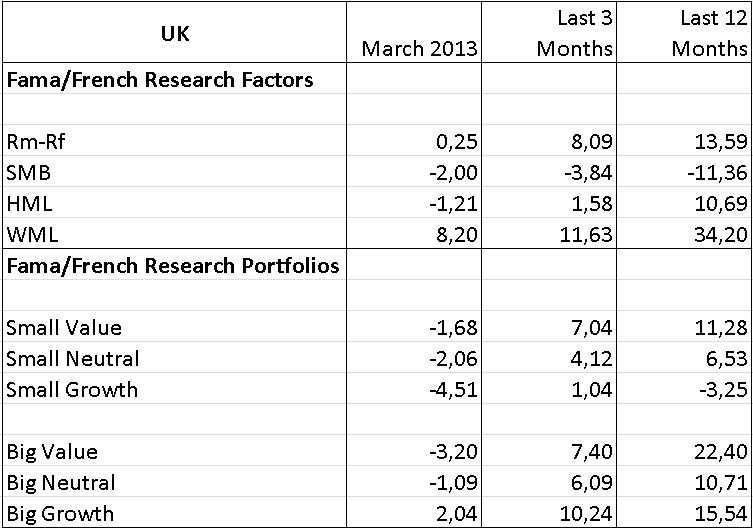
United Kingdom: Fama/French Factors, 6 Portfolios Formed on Size and Book-to-Market, 6 Portfolios Formed on Size and Momentum (downloadable files).
Market: London. Risk free rate: UK 3 months Treasury bill rate. Time series (start date): July 1988. Returns in GBP.

United States: Fama/French Factors, 6 Portfolios Formed on Size and Book-to-Market, 6 Portfolios Formed on Size and Momentum (downloadable files).
Market: NYSE, Amex, Nasdaq. Risk free rate: US 91 days Treasury bill rate. Time series (start date): July 1988. Returns in USD.

Brazil: Fama/French Factors, 6 Portfolios Formed on Size and Book-to-Market, 6 Portfolios Formed on Size and Momentum (downloadable files).
Market: Sao Paulo. Risk free rate: Brazil Treasury bill rate. Time series (start date): July 1995. Returns in BRL.
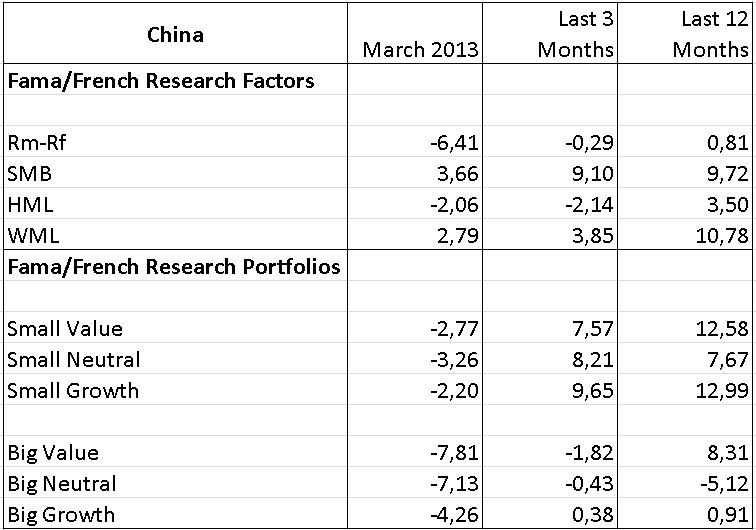
China: Fama/French Factors, 6 Portfolios Formed on Size and Book-to-Market, 6 Portfolios Formed on Size and Momentum (downloadable files).
Market: Shanghai, Shenzhen. Risk free rate: China 91 days Treasury bill rate. Time series (start date): July 1998. Returns in CNY.
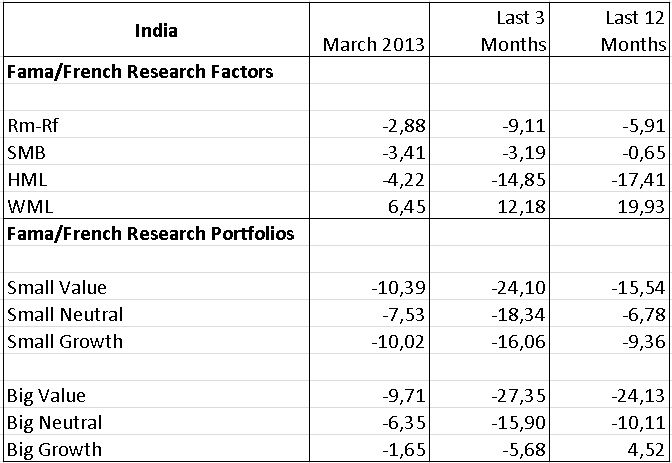
India: Fama/French Factors, 6 Portfolios Formed on Size and Book-to-Market, 6 Portfolios Formed on Size and Momentum (downloadable files).
Market: India. Risk free rate: India 91 days Treasury bill rate. Time series (start date): July 1993. Returns in INR.
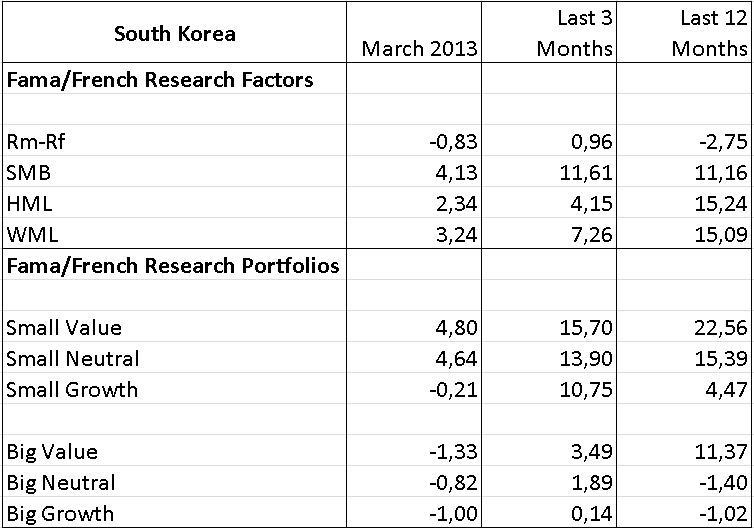
South Korea: Fama/French Factors, 6 Portfolios Formed on Size and Book-to-Market, 6 Portfolios Formed on Size and Momentum (downloadable files).
Market: Korea. Risk free rate: South Korea 91 days rate. Time series (start date): July 1992. Returns in KRW.
Portfolios Formed on P/E, P/B, P/S, P/CF, P/FCF, D/P, Current Ratio, ROE, 1 year EPS growth, gross profit margin, 1 year total return (downloadable files).
Time series (start date): from July 1987 (for P/CF and P/FCF portfolios: from July 1988). Returns in USD. Portfolios formed Annually.
Japan
Portfolios Formed on P/E, P/B, P/S, P/CF, P/FCF, D/P, Current Ratio, ROE, 1 year EPS growth, gross profit margin, 1 year total return (downloadable files).
Time series (start date): from July 1987 (for P/CF and P/FCF portfolios: from July 1988). Returns in JPY and USD. Portfolios formed Annually.
North America (Canada, United States)
Portfolios Formed on P/E, P/B, P/S, P/CF, P/FCF, D/P, Current Ratio, ROE, 1 year EPS growth, gross profit margin, 1 year total return (downloadable files).
Time series (start date): from July 1987 (for P/CF and P/FCF portfolios: from July 1988). Returns in USD. Portfolios formed Annually.
United Kingdom
Portfolios Formed on P/E, P/B, P/S, P/CF, P/FCF, D/P, Current Ratio, ROE, 1 year EPS growth, gross profit margin, 1 year total return (downloadable files).
Time series (start date): from July 1987 (for P/CF and P/FCF portfolios: from July 1988). Returns in GBP and USD. Portfolios formed Annually.
Western Europe ex UK
Portfolios Formed on P/E, P/B, P/S, P/CF, P/FCF, D/P, Current Ratio, ROE, 1 year EPS growth, gross profit margin, 1 year total return (downloadable files).
Time series (start date): from July 1987 (for P/CF and P/FCF portfolios: from July 1988). Returns in EUR and USD. Portfolios formed Annually.
Description of Fama/French Factors
Monthly and Annual Returns
Construction: SMB and HML factors are constructed using the 6 value-weight portfolios formed on size and book-to-market (see the description of the 6 size/book-to-market portfolios). WML factor is constructed using the 6 value-weight portfolios formed on size and momentum (see the description of the 6 size/momentum portfolios).
Rm-Rf, the excess return on the market, is the value-weight return on all stocks minus the risk free rate.
SMB (Small Minus Big) is the average return on the three small portfolios minus the average return on the three big portfolios, SMB = 1/3 (Small Value + Small Neutral + Small Growth) - 1/3 (Big Value + Big Neutral + Big Growth).
HML (High Minus Low) is the average return on the two value portfolios minus the average return on the two growth portfolios, HML = 1/2 (Small Value + Big Value) - 1/2 (Small Growth + Big Growth).
WML (Winners Minus Losers) is the average return on the two winner portfolios minus the average return on the two loser portfolios, WML = 1/2 (Small High + Big High) - 1/2 (Small Low + Big Low).
Stocks: Rm-Rf, SMB and HML for July of year t to June of t+1 include all stocks for which we have market equity data for the last fiscal year end before March and June of t, and (positive) book equity data for the last fiscal year end before March t. The six portfolios used to construct WML each month include stocks with prior return data. To be included in a portfolio for month t (formed at the end of the month t-1), a stock must have a price for the end of month t-13 and a good return for t-2. Starting with July 1994 (with July 1996 for Singapore, Switzerland and South Korea, and with July 1997 for India), the portfolios include stocks with average volume traded on the 5 prior days greater than one thousands shares.
Detail for 6 Portfolios Formed on Size and Book-to-Market
Monthly and Annual Returns
Construction: The portfolios, which are constructed at the end of each June, are the intersections of 2 portfolios formed on size (market equity, ME) and 3 portfolios formed on the ratio of book equity to market equity (BE/ME). The size breakpoint for year t is the median market equity for the last fiscal year end before June of year t. BE/ME for June of year t is the book equity for the last fiscal year end before March t divided by ME for March of t. The BE/ME breakpoints are the 30th and 70th percentiles. The independent 2x3 sorts on size and B/M produce six value-weight portfolios, SG, SN, SV, BG, BN, and BV, where S and B indicate small or big and G, N, and V indicate growth (low B/M), neutral, and value (high B/M).
Stocks: The portfolios for July of year t to June of t+1 include all stocks for which we have market equity data for the last fiscal year end before March and June of t, and (positive) book equity data for the last fiscal year end before March t. Starting with July 1994 (with July 1996 for Singapore, Switzerland and South Korea, and with July 1997 for India), the portfolios include stocks with average volume traded on the 5 prior days greater than one thousands shares.
Detail for 6 Portfolios Formed on Size and Momentum
Monthly and Annual Returns
Construction: The portfolios, which are constructed monthly, are the intersections of 2 portfolios formed on size (market equity, ME) and 3 portfolios formed on momentum. The monthly size breakpoint is the median market equity. For portfolios formed at the end of month t1, the lagged momentum return is a stock's cumulative return for t12 to t2. The monthly momentum breakpoints are the 30th and 70th percentiles. The independent 2x3 sorts on size and momentum produce six value-weight portfolios, SL, SN, SW, BL, BN, and BW, where S and B indicate small or big and L, N, and W indicate losers (low momentum), neutral, and winners (high momentum).
Stocks: The six portfolios constructed each month include stocks with prior return data. To be included in a portfolio for month t (formed at the end of the month t-1), a stock must have a price for the end of month t-13 and a good return for t-2. Starting with July 1994 (with July 1996 for Singapore, Switzerland and South Korea, and with July 1997 for India), the portfolios include stocks with average volume traded on the 5 prior days greater than one thousands shares.
Detail for Portfolios Formed Annually on P/E, P/B, P/S, P/CF, P/FCF, D/P, Current Ratio, ROE, 1 year EPS growth, gross profit margin, 1 year total return
Monthly Returns: from July 1987 (for P/CF and P/FCF portfolios: from July 1988) Annual Returns: from 1988
Construction: We form portfolios in each region using : price-earnings (P/E); price to book (P/B); price to sales (P/S); price to cash flow (P/CE); price to free cash flow (P/FCF); dividend yield (D/P); current ratio; return on equity (ROE); 1 year EPS growth; gross profit margin; 1 year total return. For each factor, we form 10 portfolios at the end of June each year by sorting on the factor and dividing the universe into deciles ; then we compute value-weighted and equal-weighted returns for the following 12 months. All the financial data, except the market equity, used to construct the factors for June of year t are the data for the last fiscal year end before March t. The market equity for June of year t is the market equity for the last fiscal year end before June t.
Stocks: The portfolios for July of year t to June of t+1 include stocks of the 1000 largest companies for market equity, for which we have market equity data for June of t, and (positive) book equity data for the last fiscal year end before June t.